Viewing Gentrace v2 documentation
View Gentrace v1
Gentrace home page
Search...
⌘K
Getting started
Get started
Quickstart
Installation
Initialization
Error analysis
Overview
Gentrace Chat
Derivations
Views
Alerting
Tracing
Overview
interaction()
traced()
Instrumentations
Manual LLM instrumentation
Evaluation
Overview
Experiments
Datasets
Unit tests
Dataset tests
Integrations
AI SDK
LangChain
LangGraph
Mastra
Next.js
OpenAI Agents
OpenAI (JS)
OpenAI (Python)
Pydantic AI
Administration
Single sign-on (SSO)
SCIM
Roles
Self-hosted deployment
Reference
OpenTelemetry guide
OpenTelemetry API
SDK Errors
SDK Entities
Datasets
Experiments
Pipelines
Test Cases
Support
Dashboard
Viewing Gentrace v2 documentation
View Gentrace v1
Gentrace home page
Search...
⌘K
Ask AI
Support
Dashboard
Dashboard
Search...
Navigation
Tracing
Overview
Documentation
API Reference
Documentation
API Reference
Tracing
Overview
Copy page
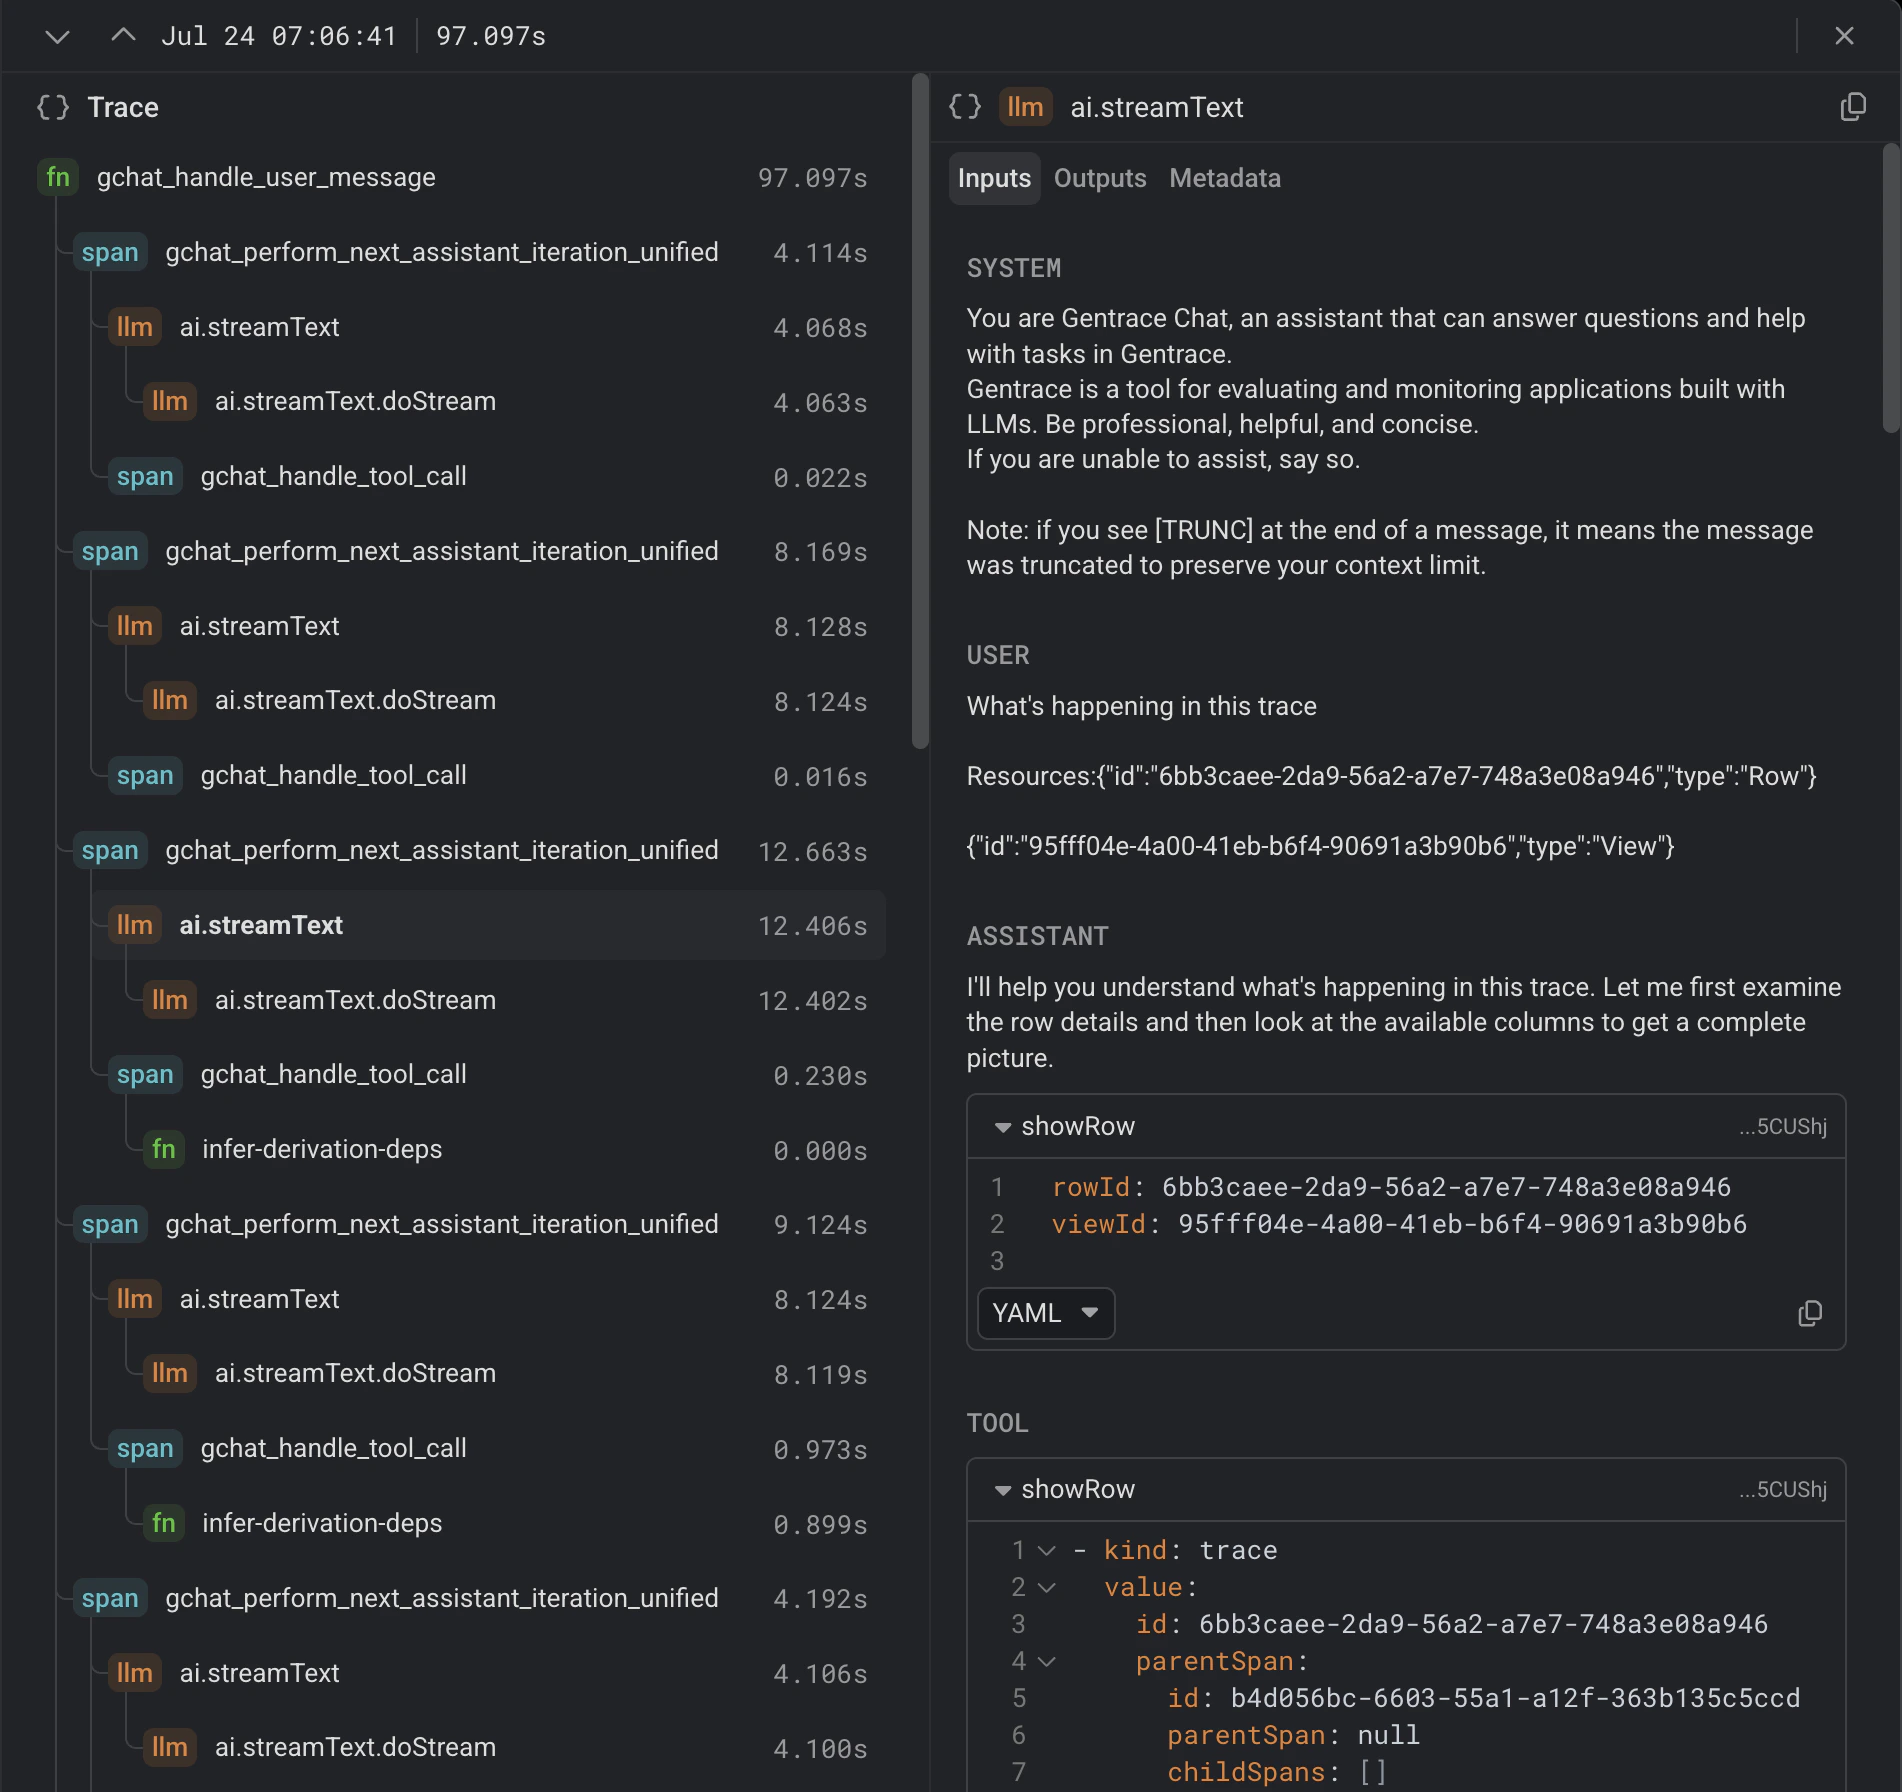
Agent traces capture the execution of your agent.
Copy page
Agent traces show the LLM messages, tool calls, and other events that happen in the execution of your agent.
To get started, either:
Follow the
quickstart
(For advanced setups) proceed to our
OpenTelemetry guide
For sophisticated agents, traces can be
very
long. Use
Gentrace Chat
to summarize and ask questions.
An example trace
Previous
interaction()
Wrap AI functions with OpenTelemetry tracing to track interactions within a Gentrace pipeline
Next
On this page
An example trace
Assistant
Responses are generated using AI and may contain mistakes.